Relationship Between Leads and Closed Revenue in B2B
Modest drops at multiple funnel stages compound into major revenue shortfalls.

In B2B sales, leads and closed revenue are separated by five or six distinct conversion stages, each with its own failure rate, and the relationship between them is rarely linear or intuitive. A team generating thousands of leads per month can still finish a quarter with thin pipeline if even two or three of those stages are underperforming. The compounding nature of funnel math means small percentage drops at multiple stages multiply into large revenue shortfalls, yet most diagnostic conversations still start and end at lead volume.
Understanding how leads translate into closed revenue requires looking beyond surface metrics and examining the mechanics of each handoff in the buying process. A lead is not a unit of revenue potential in any fixed sense; its value depends entirely on how well it fits the ideal customer profile, how quickly it is contacted, how rigorously it is qualified, and how effectively the sales process guides it through evaluation to a decision. Two companies generating identical lead volumes from the same channels can produce dramatically different revenue outcomes if their qualification standards, response infrastructure, and funnel definitions diverge. That variability isn't random. It's the predictable result of specific process decisions made upstream, and it is diagnosable when the right data is being tracked at each stage.
Your funnel is a chain of compounding failures
The standard B2B SaaS funnel runs through five sequential handoffs: visitor to lead, lead to MQL, MQL to SQL, SQL to opportunity, and opportunity to closed-won. Each handoff involves a judgment call made by a different function: marketing determines what qualifies as a lead, sales development determines what merits a real conversation, and account executives determine what warrants a proposal. These rates compound rather than add, which means a modest underperformance at three stages simultaneously produces a revenue result that looks far worse than any single stage would predict.
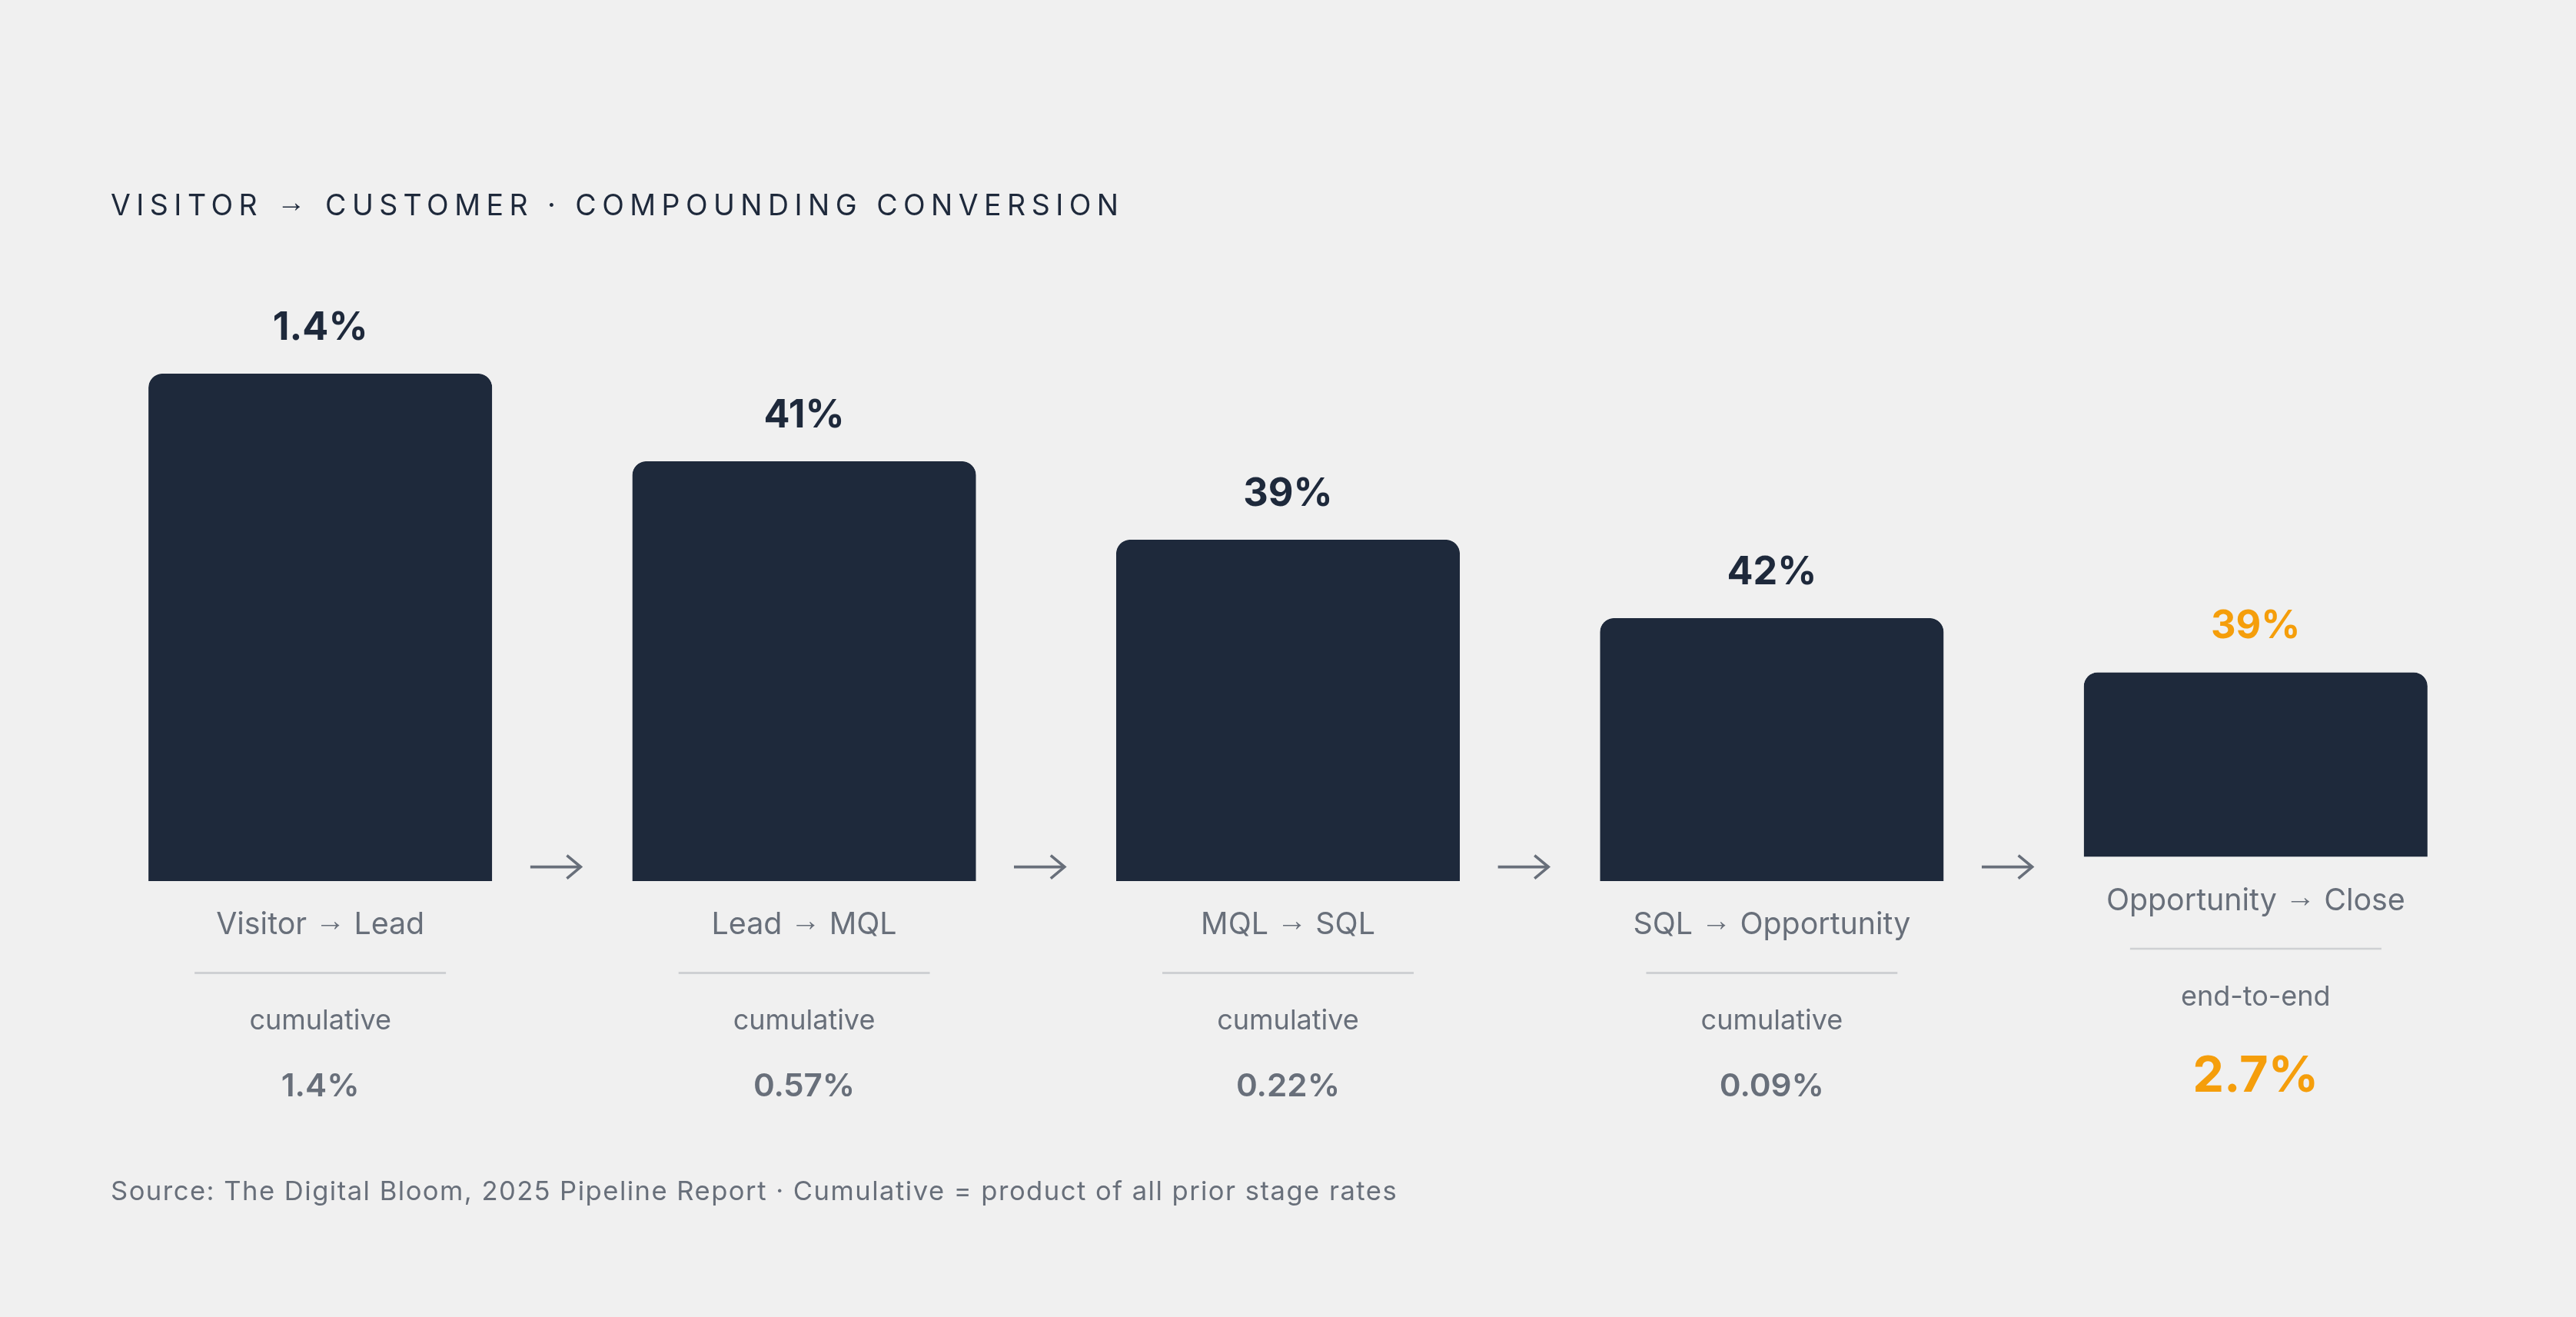
For small-to-midsize B2B SaaS companies in the $10M to $100M ARR range, 2025 benchmark data from The Digital Bloom's pipeline report shows a representative conversion shape:
Visitor to lead: 1.4%
Lead to MQL: 41%
MQL to SQL: 39%
SQL to opportunity: 42%
Opportunity to close: 39%
Multiplying those stages together produces an overall lead-to-customer rate of approximately 2.7%. That is the benchmark for a healthy funnel in this segment, not a floor to be embarrassed by.
Enterprise companies face steeper attrition at both ends: visitor-to-lead drops to 0.7% and opportunity-to-close falls to 31%, primarily because larger buying committees introduce more stakeholders capable of blocking a deal and longer evaluation timelines during which priorities shift. The compounding effect is diagnostically difficult because no single stage looks catastrophic in isolation. Shaving a few percentage points off three or four stages simultaneously produces a significant revenue shortfall that only becomes visible at the end of the quarter. A 2 to 5% overall lead-to-customer rate is the expected output of a functioning B2B funnel. The real diagnostic task is identifying which specific stage is underperforming relative to its benchmark, not reacting to the top-line conversion number in isolation.
MQL-to-SQL is where funnels go to die
If B2B funnels have a structurally weak point, the data consistently points to the MQL-to-SQL transition. 2025 figures from The Digital Bloom put MQL-to-SQL conversion at 15 to 21%, which is meaningfully worse than the stages immediately before and after it.
At that rate, more than three out of every four leads that marketing designates as qualified are rejected by sales or stall before any conversation takes place. Two root causes account for most of this attrition. First, misaligned qualification definitions: the criteria marketing uses to assign MQL status frequently differ from the criteria sales uses to determine whether a prospect is worth pursuing, and those two documents rarely get compared directly. Second, slow SDR follow-up: a lead that meets qualification criteria at the moment of form submission deteriorates in value the longer it sits uncontacted, because the prospect's attention, urgency, and openness to a conversation all decay over time.
The revenue impact of fixing this stage is disproportionate to the effort required. The Digital Bloom's 2025 data indicates that improving MQL-to-SQL conversion by 5 percentage points can increase total closed revenue by as much as 18%. MarketJoy's benchmark of roughly 15% MQL-to-SQL and 6 to 9% closed-won overall should be treated as a minimum standard rather than a target.
Teams that maintain a tightly defined ideal customer profile and apply disciplined scoring criteria improve not just this one conversion rate but every downstream stage as well, because the leads entering the pipeline are better-fit prospects from the outset. Increasing lead volume into a pipeline with a broken MQL-to-SQL stage does not solve the problem. It accelerates the waste by sending more unqualified prospects through a process that was not built to handle them.
Where your leads come from determines where they die
Conversion rates vary significantly by channel, and the differences appear not just at the top of the funnel but at every subsequent stage. Compiled figures from The Digital Bloom, drawing on FirstPageSage, MarketJoy, and PoweredBySearch across 2024 and 2025, show the following channel-level profiles:
SEO: 2.1% visitor-to-lead, 51% MQL-to-SQL. The strongest overall conversion profile across all stages measured.
Webinars: 2.2% visitor-to-lead, but only 30% MQL-to-SQL. Strong at generating initial interest but loses a significant share at qualification.
PPC: 0.7% visitor-to-lead, 26% MQL-to-SQL, 35% opportunity-to-close. Underperforms at nearly every stage regardless of spend level.
Email: 43% lead-to-MQL, 46% MQL-to-SQL, but only 32% opportunity-to-close. Converts well through the middle of the funnel and then stalls at the final stage.
Events: 40% opportunity-to-close, the highest closing rate of any channel in the dataset, reflecting the trust and relationship context that in-person interaction builds before a deal enters late-stage evaluation.
No single channel dominates every stage. The more useful analytical question is not which channel generates the most leads, but at which funnel stage a given channel's conversion strength actually produces closed revenue. A 2025 First Page Sage study found B2B companies with strong SEO programs averaged 2.4% conversion from organic traffic, and those leads entered the funnel with higher demonstrated intent because they had already researched the category before making contact. PPC's 0.7% visitor-to-lead rate illustrates the limit of scaling spend as a conversion strategy: increasing budget amplifies the same weak conversion rate at greater cost rather than improving it.
Most deals die before they close — here's why
Average B2B win rate sits at approximately 20 to 21% in 2024 and 2025 data from Lunas Consulting, meaning roughly four out of five qualified opportunities end without a closed-won outcome. Win rate varies substantially by deal type:
Expansion and upsell with existing customers: 40 to 60%
SMB deals: 25 to 35%, supported by shorter sales cycles and fewer stakeholders involved in the final decision
Enterprise deals with complex buying committees: 10 to 20%, reflecting longer evaluation timelines, more competing vendors, and a larger number of internal stakeholders who each have veto authority
Top-performing teams consistently push past 30%, and elite teams with strong qualification discipline and precise execution sustain rates around 40%.
The gap between a 20% and a 30% win rate is frequently not a closing skill problem. It is a qualification problem that originated earlier in the funnel. Opportunities that should have been disqualified at the SQL stage instead advance to late-stage evaluation, where they increase the denominator without contributing to the numerator, which suppresses the apparent win rate of the entire sales team. Addressing win rate sustainably often requires tightening qualification criteria several stages upstream rather than coaching closing technique at the end of the process.
The expansion and upsell figure of 40 to 60% also deserves direct attention. For most B2B companies, the highest-converting pipeline available is not in the new-lead queue. It is in the existing customer base, where trust is already established and the prospect's needs are already understood.
Slow response is silently killing your conversions
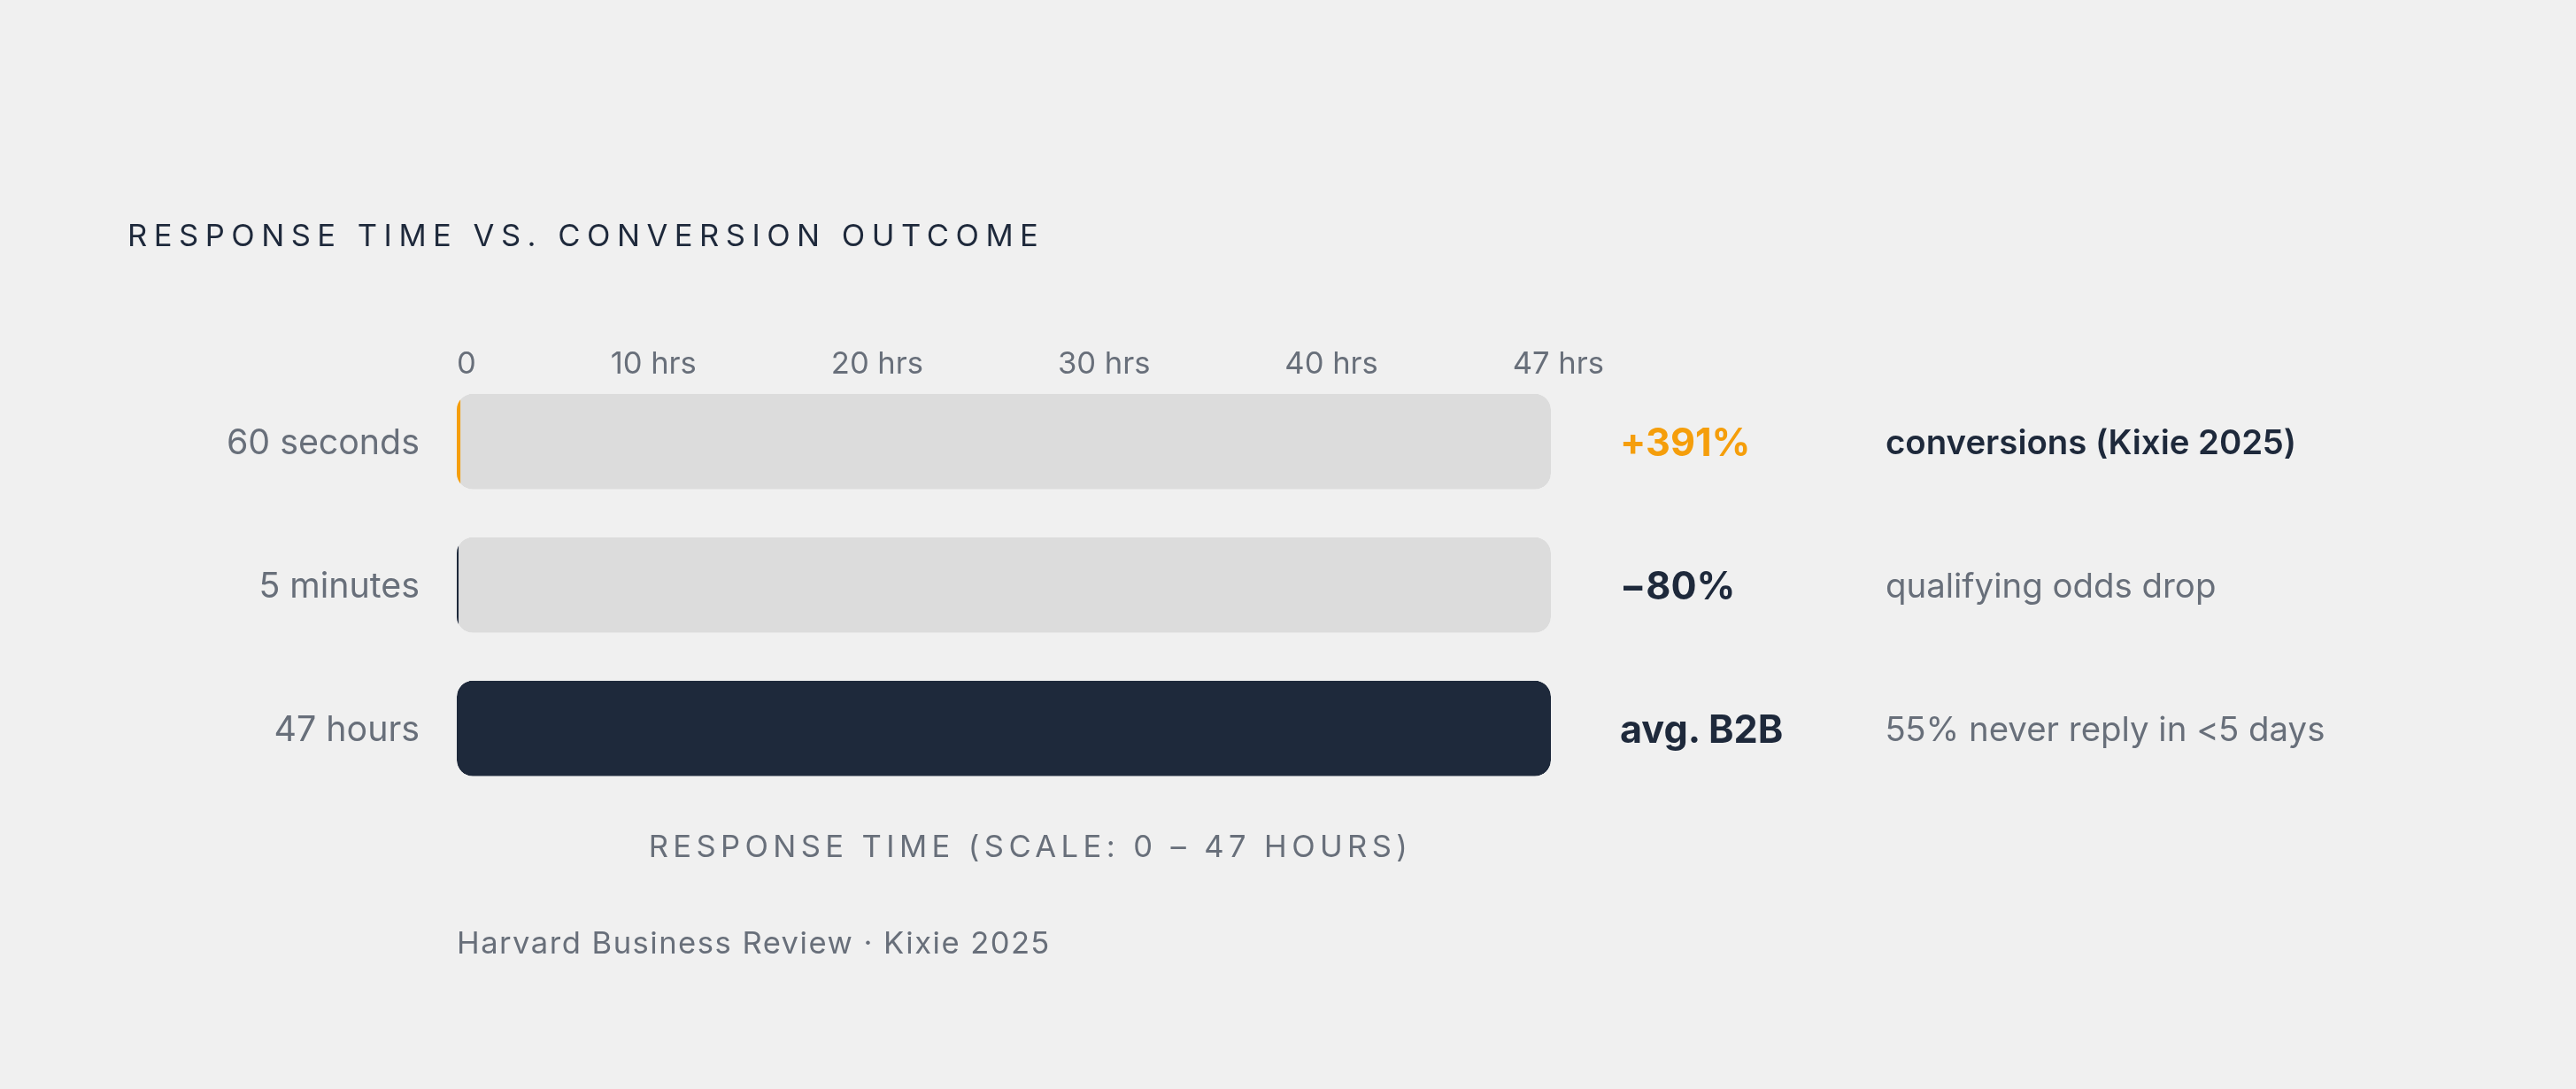
Lead response speed functions as a structural variable that affects conversion outcomes across multiple funnel stages simultaneously. Kixie's 2025 research found that responding to an inbound lead within 60 seconds increases conversions by 391% compared to slower responses. Harvard Business Review data establishes the decay rate more precisely: the probability of successfully qualifying a lead drops by 80% after five minutes of no response.
The gap between those benchmarks and actual practice is substantial. Average B2B response time runs 42 to 47 hours, and 55% of companies take five or more days to respond to inbound leads, or do not respond at all. A lead that was genuinely qualified at the moment of form submission loses much of that qualification value during the hours it spends waiting for a response, because the prospect's attention and urgency diminish and competing vendors may reach them first.
Response speed and the MQL-to-SQL conversion problem are directly connected. A qualified lead does not hold its qualification status in suspension while it waits in a queue; its value deteriorates on the same timeline as an unqualified lead, just from a higher starting point. The structural fix is routing, instant automated acknowledgment, and calendar scheduling built into the workflow so that response time does not depend on which SDR happened to check their inbox first. Teams that treat fast response as a workflow infrastructure requirement rather than an individual effort variable extract measurably more closed revenue from the same lead volume.
Better qualification beats more leads every time
Landbase's 2026 research on lead qualification found that properly scored and qualified leads convert at 40%, compared to 11% for unqualified prospects processed through the same funnel infrastructure. That difference, nearly four times the conversion rate, stems entirely from the quality of the initial qualification decision rather than from anything that happens later in the sales process.
Companies using automated qualification tools report roughly a 20% increase in lead conversion rates and 10% or more revenue growth within six to nine months of implementation, per the same research. The broader industry context makes the stakes clear: the B2B SaaS industry-wide conversion rate sits at approximately 1.1%, a figure that reflects in large part how many teams are routing unqualified leads into a sales process calibrated for qualified ones.
Tighter qualification produces several compounding benefits. It removes poor-fit prospects before they consume sales capacity. It gives representatives enough context about each prospect to conduct outreach that reflects genuine research rather than a generic template. And it improves win rate from both directions simultaneously: fewer bad-fit opportunities entering the pipeline, combined with higher close rates on the opportunities that remain.
The strategic consequence follows directly from the math. A team that doubles lead volume without improving qualification roughly doubles its waste, since conversion rates stay flat while costs increase. A team that tightens qualification at the MQL-to-SQL gate can extract more closed revenue from the same lead volume, or even a smaller one, because a higher proportion of what enters the pipeline is worth pursuing.
Know your industry's numbers or you're flying blind
Pipeline velocity combines deal size, win rate, and sales cycle length into a single metric showing how quickly a funnel converts opportunities into recognized revenue. The Digital Bloom's 2025 median velocity figures by industry:
Marketing and Advertising: $743 per day
SaaS and Technology: $1,847 per day, based on a $12,400 average deal size and 22% win rate
Financial Services: $2,134 per day, based on a $31,200 average deal size across a longer sales cycle
Real Estate and Construction: $2,456 per day, the highest velocity among the industries surveyed
The comparison between SaaS and Financial Services is instructive. Financial Services achieves higher pipeline velocity despite a lower win rate and a longer sales cycle because average deal size does enough of the work to more than compensate. Optimizing win rate in isolation, without accounting for deal size and cycle length, can produce misleading conclusions about where to focus improvement efforts.
The median B2B SaaS sales cycle in 2025 runs 84 days, while the optimal range is 46 to 75 days. Cycles that extend beyond that upper bound typically indicate deals stalling at the opportunity stage rather than at final close, which points to evaluation and proposal management problems rather than closing skill deficiencies. Industry context is essential before drawing conclusions from any of these numbers. A 22% win rate in SaaS is consistent with sector norms. The same 22% win rate in a category where top performers consistently clear 30% represents a meaningful gap worth addressing.
Content drives pipeline — if you bother to measure it
Content's contribution to pipeline can be measured at the individual deal level, which produces the kind of revenue-attributed data that holds up to rigorous scrutiny. When a significant share of closed deals in a given quarter involved content consumption at some point in the buying journey, that engagement traces back to a defensible portion of closed revenue, expressed in dollars rather than page views or keyword rankings.
Organic search leads convert at higher rates than outbound leads because the intent signal embedded in how they arrived is qualitatively different. A prospect who searched for a solution, evaluated multiple options through content, and self-selected into a funnel demonstrates a different level of purchase readiness than one who received a cold outreach message. This is the same mechanism behind SEO's strong MQL-to-SQL performance: search-sourced leads score better against qualification criteria because they have already completed a meaningful portion of their own evaluation before making contact.
For content teams, that finding reframes how return on investment should be measured. Content ROI is most accurately expressed as the share of closed revenue attributable to deals that touched content during the buying process, and how that group's conversion rates compare to cold outbound at each funnel stage. The performance gap between content-sourced and outbound leads rarely comes from publishing volume. It comes from the absence of measurement connecting content interactions to funnel-stage outcomes, which makes it impossible to determine whether any specific content investment is contributing to revenue or simply generating activity.
For B2B SaaS teams specifically, content that earns genuine search authority and earns citations in AI-generated answer results attracts leads that enter the funnel with higher demonstrated intent and convert at better rates across every subsequent stage.
Most B2B teams can't see where their funnel is broken
CMI's 2025 benchmarks found that only 22% of content marketing teams describe their programs as very successful. CMI's 2026 report found approximately one-third of respondents still unable to measure content effectiveness in any reliable way. Those two figures together identify a persistent structural problem: the gap between running marketing programs and knowing whether those programs are driving revenue has not narrowed, even as the measurement tools available have grown considerably more sophisticated.
The root cause in B2B has a specific shape. Revenue from a lead generated today typically closes months later, creating a temporal gap that makes attribution difficult. Different funnel stages are owned by different teams operating under different definitions of key terms like "qualified," and those definitions are rarely documented or reconciled formally. Most reporting environments stitch together data from tools that were not designed to share data across the marketing-to-sales handoff, which means stage-level conversion visibility often requires manual work that does not happen consistently.
A working measurement model requires three things: stage-by-stage conversion rates tracked over time rather than reported as point-in-time snapshots, source-level attribution that remains intact through the handoff from marketing to sales, and a shared definition of lead qualification that both teams have agreed to and consistently apply. Without that foundation, lead volume continues to be reported as a proxy for pipeline health, and revenue outcomes continue to arrive at the end of the quarter as surprises rather than as the predictable output of a process that was measured at every stage along the way.